
webropol analytics
Experience the power of advanced analytics
Webropol Analytics is a comprehensive additional module that brings the power of Professional Statistics and Insight at your fingertips. Experience the tools to dive deep into qualitative, quantitative, and predictive analysis.

advanced analytics
Discover deeper insights with Webropol Analytics
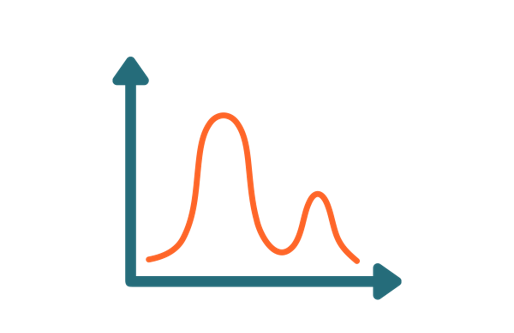
Professional Statistics – Quantitative Analysis
Elevate your survey outcomes with comprehensive analysis capabilities and versatile visual reporting functions. Discover key insights instantly using interactive result tables. Automated graph generation streamlines reporting, ensuring efficient analysis of quantitative data.
Insight – Simulate and Predict
Experience the revolutionary Webropol Insight—a statistical analysis tool that requires no in-depth statistical expertise. Empower decision-makers with predictive capabilities, providing guidance for navigating various situations. Insight enables proactive actions, making it indispensable for managers, directors, and board members alike.
Webropol Analytics redefines data exploration
- Understand the impact of changing factors on your outcomes.
- Identify key areas of focus to navigate challenging scenarios.
- Encourage recommendations among diverse interest groups.
Webropol Professional Statistics
Basic Analyses
t-test (independent groups and related samples)
Wilcoxon tests
Mann-Whitney U-test
Kruskal-Wallis test
Chi2
GAP analysis

Variance Analyse
ANOVA
Correlation analysis (Pearson, Spearman)
Cronbach’s α
Multidimensional Scalings
Factor Analyses
SOM
Sammon analysis
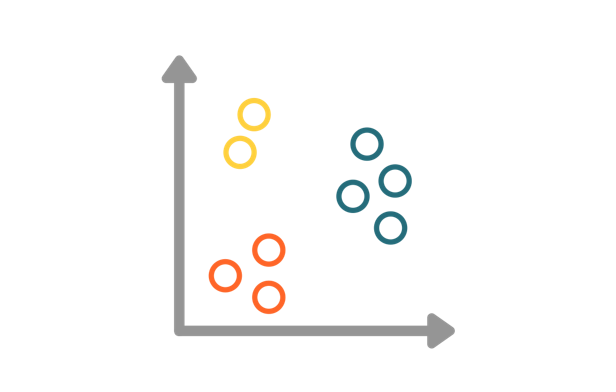
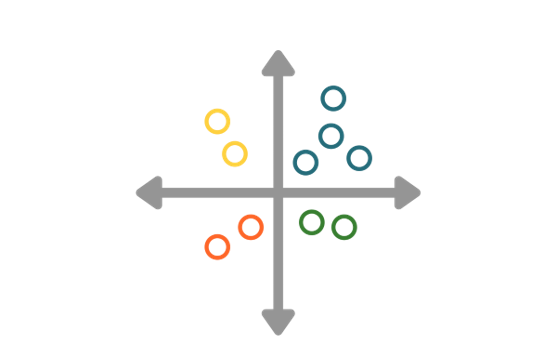
Cluster Analyse
Visual clustering
Hierarchical clustering

Regression Analyses
PLS
Stepwise regression

Advanced Cross Tabulation Features
Shows both percentages and average values
Indicates statistically significant differences
Automated chart creation
webropol modules
Webropol can do it all. From one module to a whole solution.


BI View
Access, share, and harness key insights with online dashboards, enabling your organisation to lead with real-time knowledge.

